
COVID-19 Data for Action: The RCCE Collective Service Global Database and Dashboard
Description
“The RCCE Collective Service database creates a public good so we don’t have to use our own resources to get the same information. This saves us [as partners] so much time and money and means we can make more efficient use of funding” — Tom Black, The Gates Foundation.
INTRODUCTION
The risk communication and community engagement (RCCE) Collective Service database is a first-of-its-kind repository of social and behavioral data on COVID-19, covering 198 countries and consisting of over 250,000 data points from 411 different data sources. The database, and the dashboard that visualizes this data, is an initiative borne out of the Collective Service’s (CS) commitment to provide critical social and behavioral information to partners working to end the COVID-19 pandemic. Insights drawn from the dashboard and the database have come to influence how partners design interventions, make investment decisions, and incorporate RCCE into broader public health programming.
Since its inception a little more than a year ago, the database/dashboard has become a key resource informing COVID-19 programs and initiatives among CS partners including WHO, IFRC, UNICEF, The World Bank, The Bill & Melinda Gates Foundation, and many others. It has strengthened existing networks and partnerships by building unique, invaluable datasets that may not have been available otherwise. At the same time, it has generated new collaborations by attracting organizations who want to contribute, expand, or utilize the database/dashboard to improve vaccine uptake, adherence to prevention measures, and other intervention applications. Finally, as an engaging and informative data visualization, the RCCE dashboard generates relatively significant web traffic, showcasing the capacity of the CS to collate, vet, and make publicly available, high-quality social and behavioral data.
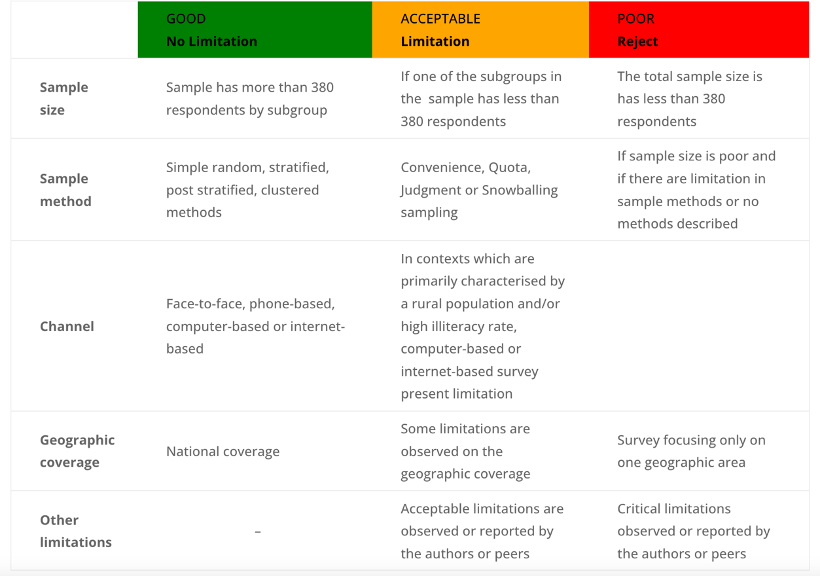
This table provides an example of how data is analyzed for representativeness. Only data that meets “Good” or “Acceptable” standards are included in the database. Other limitations include doubts about data quality, including conflicts of interest
PROCESS & FEATURES
To maintain, update, and expand the database, the Information Management team at the CS pulls relevant data from websites, dashboards, field work assessments, surveys, opinion polls, reports, and peer-reviewed publications. Creating a coherent database from such a diverse range of sources is a fundamental challenge. During the design phase of the database, the Information Management team of the CS worked across pillars, engaging the expertise of the Social Science team to create an innovative data selection methodology and structure the data according to the COVID-19 Behavioral Change Framework.
At the outset, there were methodological obstacles to comparing datasets with different sample sizes, time scales, instrument designs, and so on. While a traditional approach to harmonizing the data might have required that data adhere strictly to one universal survey or data collection method, partners quickly realized that such an approach discounts the need for data collection to be context specific and severely limits the amount of data that can be explored, compared, and triangulated. The CS therefore developed transparent selection criterion to inform users regarding representativeness within the data.
Data that has been rigorously evaluated for inclusion in the database is also classified according to how well it matches the COVID-19 Behavioral Change Framework. This Framework, which underpins the RCCE database/dashboard, was developed in consultation with CS partners and is based on the UNICEF behavioural driver model. A comprehensive set of 35 RCCE core indicators, along with six dimensions for each indicator, characterize quantitative data concerning perceptions, knowledge and practices, and social and structural factors that influence health behavior in the context of the COVID-19 pandemic. Having gone through selection, indicator matching, and a representativeness evaluation, the data is then compiled and aggregated to populate the dashboard, or for users taking a deeper dive into the database.
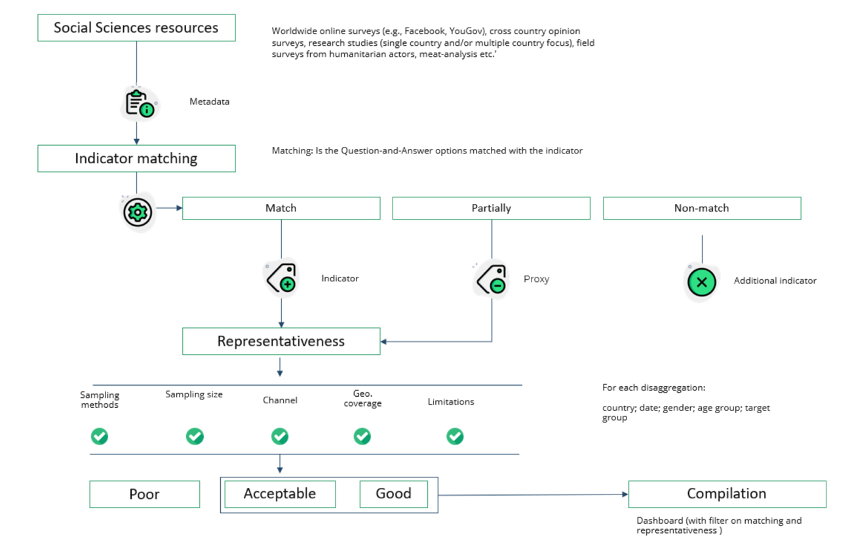
This flow chart provides an overview of how social and behavioral data for the database/dashboard is processed from beginning to end.
CHALLENGES
Big data approaches are still somewhat new in the field of public health and international development. In the beginning, some partners were concerned about data quality and wanted only their own data in the database. The CS responded by making a concerted effort to help partners understand the value of creating a repository at scale and addressing concerns by offering confidence interval calculations for data sources.
Depending on the context, the initiative also encountered a great deal of hesitancy at the country level by partners who were concerned about privacy and potential negative ramifications of sharing data that could be seen either by the local government or by international organizations like the WHO. Again, the CS worked hard to strengthen these partnerships and build trust so that data could be shared safely and respectfully.
Finally, the Information Management and Social Science teams struggled to capture the complexity of social and behavioral measures in such a brief format. This has meant that the data synthesis is sometimes not rich or detailed enough for use at the country level and there is a recognized need to improve the data for country-level decision making. For example, efforts are currently under way to develop data visualizations that can show relevant qualitative data alongside quantitative metrics.
HIGHLIGHTS
“The scale of the Collective Service’s networks and partners gives me confidence that the right inputs are in the database. I’m not sure where else I would be able to find this data.” – Jeremy Cooper, The Gates Foundation
- The Gates Foundation has used the RCCE database to perform multi-variate regression analysis on vaccine acceptance to understand potential correlations between vaccine hesitancy and case rates and/or death rates. The World Bank has used the RCCE database to uncover the efficacy of interventions via in-depth analysis of country-level data. This analysis was used to inform funding decisions.
- WHO EURO is working closely with the Collective Service to integrate 19 in-depth behavioral insights surveys conducted across Europe.
- WHO HQ uses the dashboard/database as an invaluable resource for shaping and informing COVID-19 policy and research. The data is incorporated into regular briefings and analysis including WHO member states briefings and international expert consultations with national and regional Centers for Disease Control (CDC), among others. Identifying the latest social and behavioral trends is an essential part of advocating for RCCE responses at the global, regional and national levels.
- The Africa Infodemic Response Alliance regularly uses the RCCE database for understanding social and behavioral trends and triangulating this data with social media listening in Eastern and Southern African countries.
MOVING FORWARD
In many ways, the RCCE global database/dashboard has been a point of departure for critical social and behavioral data that can inform RCCE policy and action. Creating and implementing a workable methodology, building a set of meaningful indicators, and getting partners on board to understand the value of the project was just the first phase. As the initiative continues, the RCCE global database/dashboard will be expanded to include the all-important qualitative data that is so essential to building communications campaigns and engaging communities. As part of this effort, the CS plans to incorporate qualitative data being collected through community feedback mechanisms. In the future, the CS hopes to provide automated reports to inform activities and coordination at the country-level.
More focused dashboards may also be developed in the future in order to visualize finer details within the database. Just as important, the CS will soon release a web API (public access to the database through a back-end server) that will allow partners to create their own dashboards/visualize data that is relevant to their own interests and projects.
As the CS moves forward, we will continue to document how partners are utilizing the database and share these stories within the CS community in order to spark new ideas, nurture collaboration, and build solidarity to fight COVID-19 and other social and public health issues as they arise.
For more information about the RCCE dashboard/database please visit: https://www.rcce-collective.net/data/behavioural-indicators/
Additional languages

DETAILS
Organisation
Emergency
Scope
Region
Keywords